A/B Testing
A/B testing has been used in academics and industry. In recent years, most corporations routinely use A/B testing to enhance the release of their product line. For instance, Amazon uses A/B test to explore the apparition of coupon codes during checkout. Amazon also tested the appropriate location to show product recommendations. Bing's team improve their revenue by changing where ads appear during user research. In this article, we will cover the most important aspect of A/B testing from the fundamental concept to the interpretation of the result including decision making.
What we will cover
image source: giphy

- 1 Terminology
- 2 What's the importance of A/B test
- 3 Three pillars to consider
- 4 Setting up the experiment
- 5 Running the experiment
- 6 Interpreting results and decision making
Before we dive into the nitty-gritty details, we must clarify these commonly used words.
- Overall evaluation criteria: Criteria used to evaluate the result of the test
- Variant: the groups being evaluated. A and B are variant in the test
- randomization unit: Hashing technique ued to ensure each variant is associated with control or treatment
- Effect size: If we are testing conversion rate, this is the expected difference between conversion rate
- Power: probability of fining a difference if in fact, a difference exist in the test
- P-value: probability of getting the observe statistic if our null hypothesis is true
There are three main points that we believe A/B test could bring to the table. First, it can detect small changes. It can be run on a website for instance to detect how user behavior changes. Second, It allows us to establish the presence of causality. Again, by running a test, we can figure out a new change in UI caused users number of pageview. Lastly, we can reduce uncertainty. Let's imagine in a meeting we are unable to assess the validation of two main ideas. A test can be performed to distinguish which idea will work. Even if a definitive result is found, we leverage the obtain information for reducing ambiguity.
Before companies considered the implementation of A/B testing, there should evaluate whether there is a willingness to invest in these types of projects. Sometimes test implementations are costly. Other times the results are a complete failure. Another aspect to consider is if the company is capable of making a data-driven decision.
For this section on, we will imagine that we work for a fictional company and there is a desire to implement A/B testing. Our company has developed a new landing page but we would like to test it before the official launch. Let's set up the hypothesis. Ho is the null and H1 is the alternative.
Ho: new_page ≤ old_page
H1: new_page > old_page
We will also assume that the product manager requested a 95% confidence with a recommended power level of 80% and an improvement effect size of 2% from the old page which is currently measured to be 10%. The metric considered is the conversion rate.
Sample size
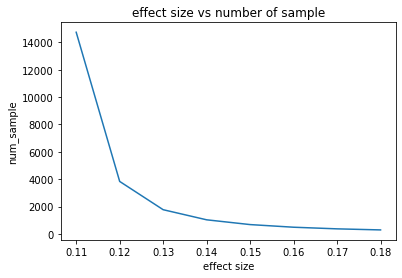
We compute the sample size using two ways. scipy module. . After computation, we obtained the minimum value of
3835 which represent the number of user required for each group (control and experiment).
 The calculated value seems to be reasonable. However, if we want to inform our project manager of potential wiggle room in terms of the number of samples required for the testing, we can simulate several values as shown below.
 .
.
As we can see, when we increase the proportion of improvement rate from 2% to about 9%, we notice a gradual decrease in the number of samples required for the testing. What it tells us is that, if we want a small improvement in conversion rate, we will likely need more sample size but the sample size will be lower if the project manager accepts a higher rate. This can be beneficial for startups that often have the inability to collect significant data.
Bootstrap method
Now that we know the sample size and we assume the data is collected ( kaggle), we compute the experiment. We start by using the bootstrap technique in which we sample 1000 from the data for each group and we compute the conversion rate. The result is used to simulate a normal distribution with the same spread and size. See the below code for more details.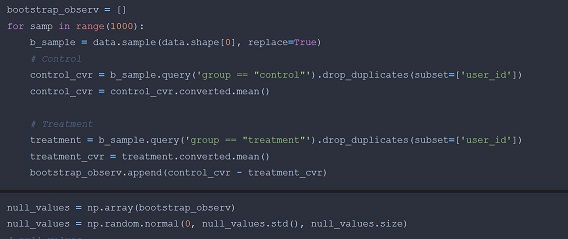
Here we can observe the histogram plot showing the distribution of the simulation sample. Note that the vertical line represent the our mean conversion difference rate from the two groups. Since we our initial set up states that H1: new_page > old_page, we can compute our p-value with following formula. p_value = (null_values > observ_dif).mean()
With this approach, we have a p-value of 0.06 which is higher that 0.05. We can then conclude that we fail to reject the null. this means that our alternative is not true.
Scipy method
For this approach, there are two reference that we found very simple and well explained that it is best to just have the reader explore them instead of having us repeat similar content. Please find out more by visiting kaggle and medium.
Both article also draw the conclusion that the p-value is higher than 0.05 as we did. This tells us the power of bootstrapping
Note that before drawing any conclusion, it is important to perform some sanity checks such as checking that the control and treatment are properly assigned as expected. Also, verify that there was no surprising latency that occurs overall during the test that might have affected user experience. To interpret the results, few things that we can take into consideration are the cost of launching. Does the benefit outweigh the cost? When it comes to cost, we should also consider the cost of maintenance.