Practical Statistics
What is data?
What are the type of data types? There are two types of dat type. Quantitative data and Categorical data. Quantitative data is mainly numerical that can be leverage by mathematical operations. Categorical data contains non numerical values that can be used to group contents.
There are subcategories of categorical values such as:
- Ordinal: these values are ordered such as school letter grades (A,B,C...)
- Nominal: These are not ordered. eg. Dog breed (Shiba inu, German Shepherd, ...)
- Continuous: eg. temperature values, stock prices, ...
- Discrete: Number of pets that a family has at home
Descriptive Statistics
Let's first define the difference between descriptive and inferential statistics. In descriptive statistics we are trying to describe the data collected but inferential statistics focuses on drawing conclusion about the data. How to analyze Quantitative data?. To analyze quantitative values data, we can focus on the measures of center (mean, media, mode), measures of spread (range, Interquartile range, standard deviation, variance), outliers , shapes (Right-skewed, Left-skewed, Symmetric). What type of plot use? For quantitative data Histogram is commonly used but some alternate plotting techniques are shown below:- Normal Quantile Plot
- Stem and Leaf Plot
- Box and Whisker Plot
- Pie Chart
- Pareto Chart
Binomial Distribution
We can use this type distribution to find the outcome of two events. It is basically the probability of success or failure. For instance, when we gamble, we either win (success) or lose (failure).Conditional Probability
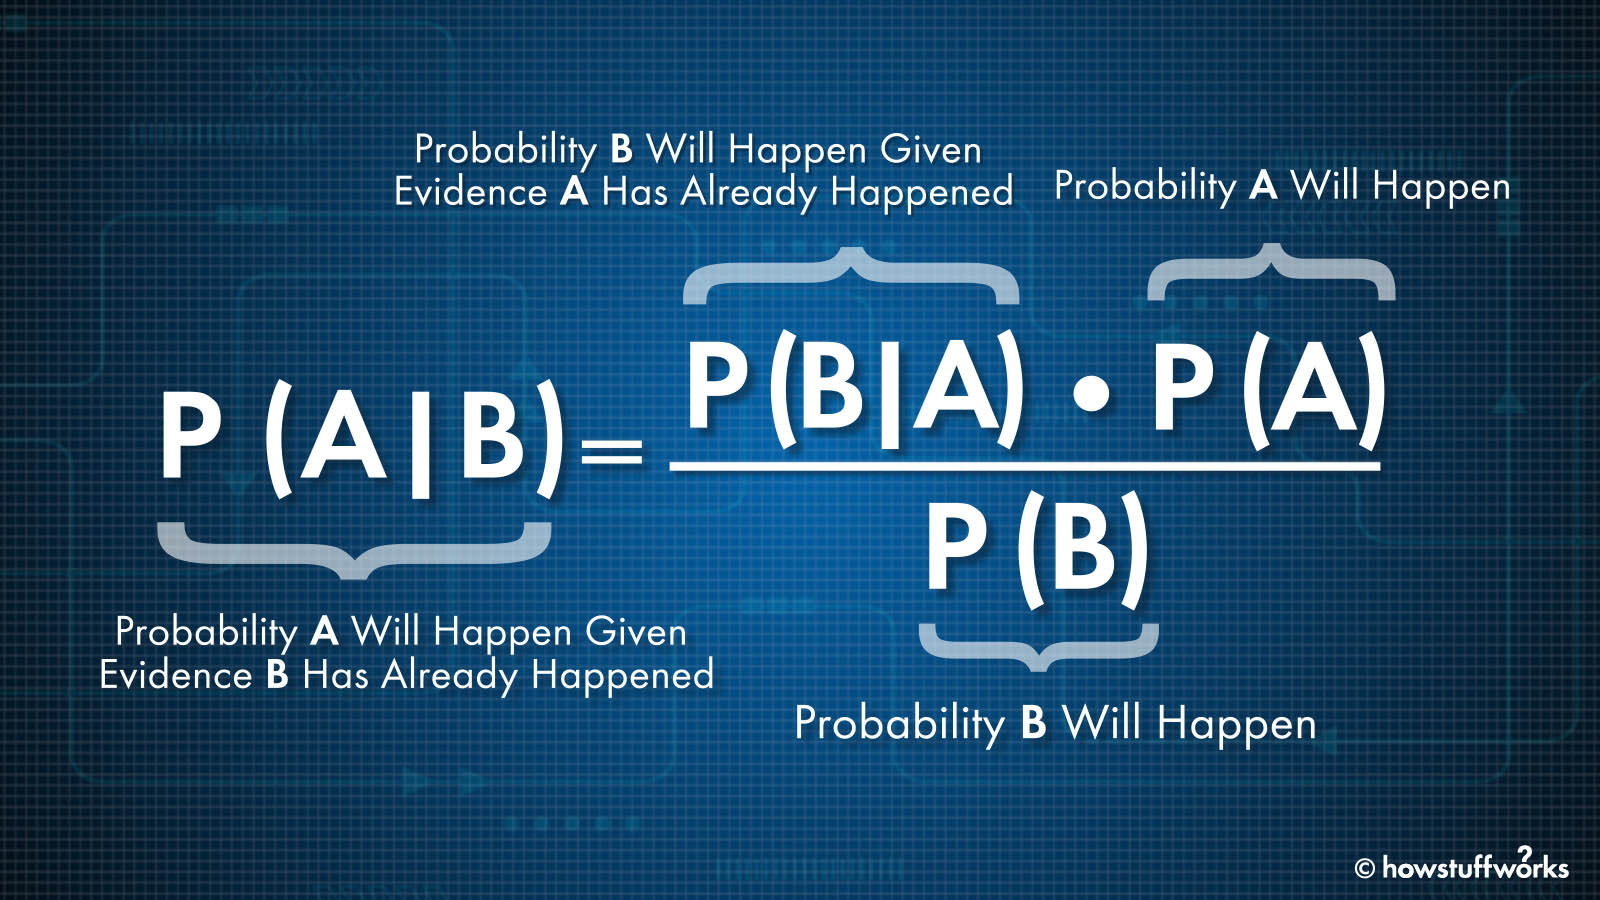
investopedia has great explanation which I will refer you to take peek at Conditional Probabilityt sectionBayes Rule
Bayes rule is one of the most import rule that is being used in machine learning. Once again, I leave a link from freecodecamp because the explanation is clear and simplistic.Sampling distributions and the Central Limit Theorem
In this section we will look into the law of large number and the central limit theorem. As the sample size increases, the sample mean gets closer to the same mean as the population mean. This what the law of large number stipulates.Central limit theorem states that the sample distribution mean of the mean will become a gaussian distribution with enough sample size.
Confidence Intervals
wikipedia defines confidence interval as "is a type of estimate computed from the statistics of the observed data. This gives a range of values for an unknown parameter (for example, a population mean)." Scipy and Numpy has great libraries that can be used to compute sampling and computing confidence interval.Hypothesis Testing
Upcoming